Reverse osmosis (RO) technology can be a complicated subject, particularly without an understanding of the specific terminology that describes various aspects of RO system operation and the relationships between these operating variables.
This bulletin defines some of these key terms and provides a brief overview of the factors that affect the performance of RO membranes, including pressure, temperature, feedwater salt concentration, permeate recovery, and system pH.
Definitions
Recovery
The percentage of membrane system feedwater that emerges from the system as product water or Òpermeate.Ó Membrane system design is based on expected feedwater quality and recovery is fixed through initial adjustment of valves on the concentrate stream. Recovery is often fixed at the highest level that maximizes permeate flow while preventing precipitation of super-saturated salts within the membrane system.
Passage
The opposite of “rejection,” passage is the percentage of dissolved constituents(contaminants) in the feedwaterallowed to pass through the membrane.
Permeate
The purified productwater produced by a membrane system.
Flow
Feed flow is the rate of feedwater introduced to the membrane element, usually measured in gallons per minute (gpm). Concentrate flow is the rate of flow of non-permeated feedwater that exits the membrane element. This concentrate contains most of the dissolved constituents originally carried into the element from the feed source. It is usually measured in gallons per minute (gpm).
Flux
The rate of permeate transported per unit of membrane area, usually measured in gallons per square foot per day (gfd). Dilute solution Ð purified water solution, RO system product water.
Concentrated solution
brackish water solution such as RO system feedwater.
Effect of pressure
Feedwater pressure affects both the water flux and salt rejection of RO membranes. Osmosis is the flow of water across a membrane from the dilute side toward the concentrated solution side. Reverse osmosis technology involves application of pressure to the feedwater stream to overcome the natural osmotic pressure. Pressure in excess of the osmotic pressure is applied to the concentrated solution and the flow of water is reversed. A portion of the feedwater (concentrated solution) is forced through the membrane to emerge as purified product water of the dilute solution side (please see Figure 1).
As shown in Figure 2, water flux across the membrane increases in direct relationship to increases in feedwater pressure. Increased feedwater pressure also results in increased salt rejection but, as Figure 2 demonstrates, the relationship is less direct than for water flux.
Because RO membranes are imperfect barriers to dissolved salts in feedwater, there is always some salt passage through the membrane. As feedwater pressure is increased, this salt passage is increasingly overcome as water is pushed through the membrane at a faster rate than salt can be transported.
However, there is an upper limit to the amount of salt that can be excluded via increasing feedwater pressure. As the plateau in the salt rejection curve (Figure 2) indicates, above a certain pressure level, salt rejection no longer increases and some salt flow remains coupled with water flowing through the membrane.

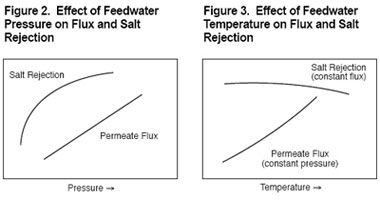
Effect of temperature
As Figure 3 demonstrates, membrane productivity is very sensitive to changes in feedwater temperature. As water temperature increases, water flux increases almost linearly, due primarily to the higher diffusion rate of water through the membrane.
Increased feedwater temperature also results in lower salt rejection or higher salt passage. This is due to a higher diffusion rate for salt through the membrane.
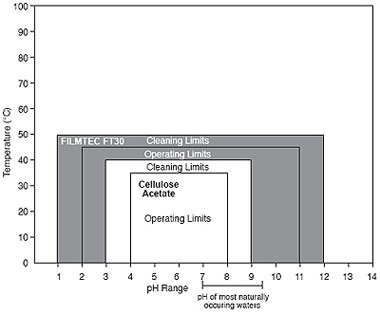
The ability of a membrane to tolerate elevated temperatures increases operating latitude and is also important during cleaning operations because it permits use of stronger, faster cleaning processes. This is illustrated by the comparison of the pH and temperature ranges of thin-film composite membrane and a cellulose acetate (CA) membrane in Figure 4.
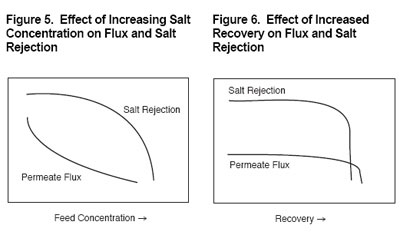
Effect of salt concentration
Osmotic pressure is a function of the type and concentration of salts or organics contained in feedwater. As salt concentration increases, so does osmotic pressure. The amount of feedwater driving pressure necessary to reverse the natural direction of osmotic flow is, therefore, largely determined by the level of salts in the feedwater.
Figure 5 demonstrates that, if feed pressure remains constant, higher salt concentration results in lower membrane water flux. The increasing osmotic pressure offsets the feedwater driving pressure. Also illustrated in Figure 5 is the increase in salt passage through the membrane (decrease in rejection) as the water flux declines.
Effect of recovery
As shown in Figure 1, reverse osmosis occurs when the natural osmotic flow between a dilute solution and a concentrated solution is reversed through application of feedwater pressure. If percentage recovery is increased (and feedwater pressure remains constant), the salts in the residual feed become more concentrated and the natural osmotic pressure will increase until it is as high as the applied feed pressure. This can negate the driving effect of feed pressure, slowing or halting the reverse osmosis process and causing permeate flux and salt rejection to decrease and even stop (please see Figure 6).
The maximum percent recovery possible in any RO system usually depends not on a limiting osmotic pressure, but on the concentration of salts present in the feedwater and their tendency to precipitate on the membrane surface as mineral scale. The most common sparingly soluble salts are calcium carbonate (limestone), calcium sulfate (gypsum), and silica. Chemical treatment of feedwater can be used to inhibit mineral scaling.
Effect of pH
The pH tolerance of various types of RO membranes can vary widely. Thin-film composite membranes s are typically stable over a broader pH range than cellulose acetate (CA) membranes and, therefore, offer greater operating latitude (please see Figure 4).
Membrane salt rejection performance depends on pH. Water flux may also be affected. Figure 7 shows that water flux and salt rejection for membranes are essentially stable over a broad pH range.
As illustrated in Figure 4, the stability of membrane over a broad pH range permits stronger, faster, and more effective cleaning procedures to be used compared to CA membranes.